This function plots the density of APO for a specified effect type from bayesmsm output.
Value
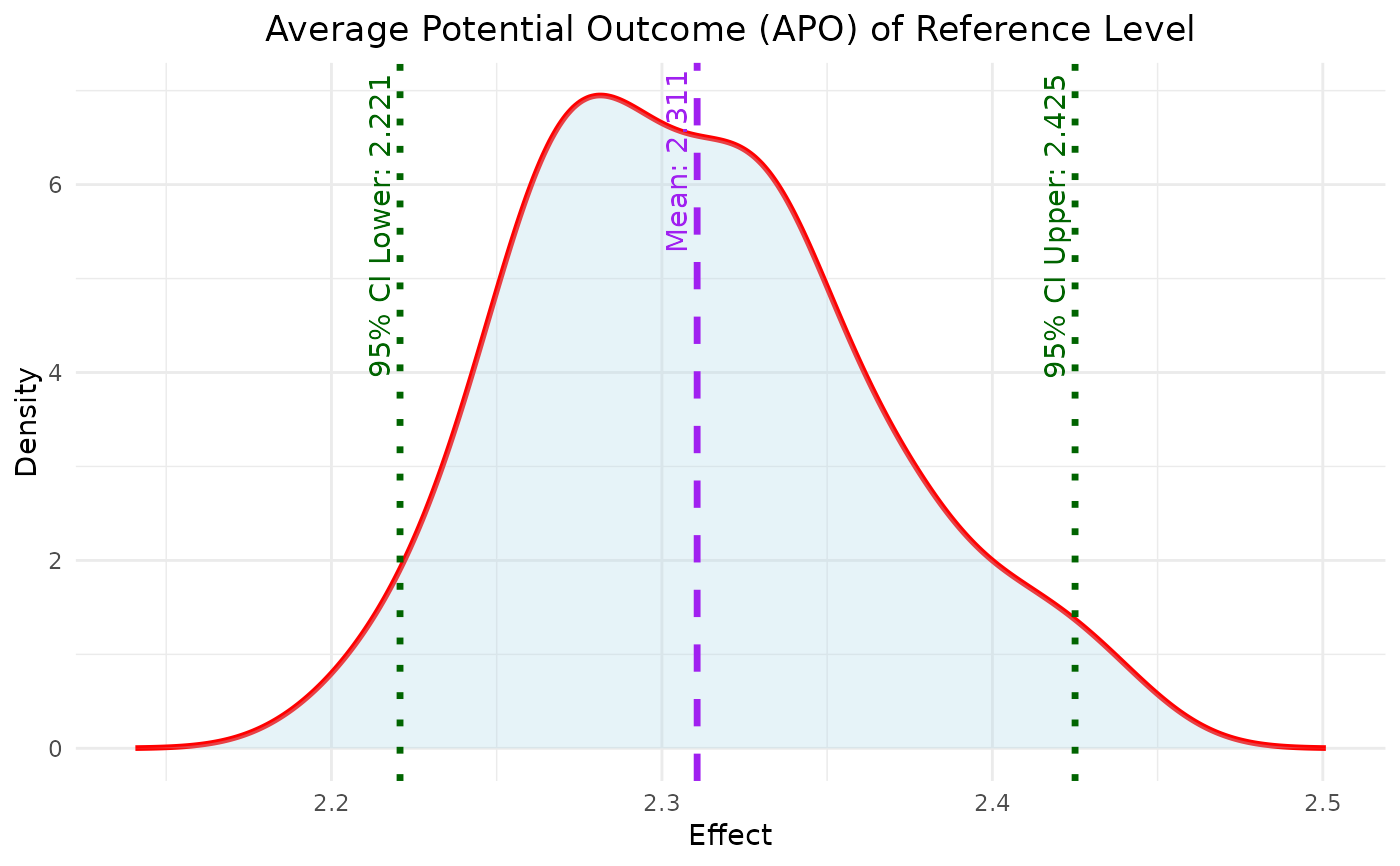
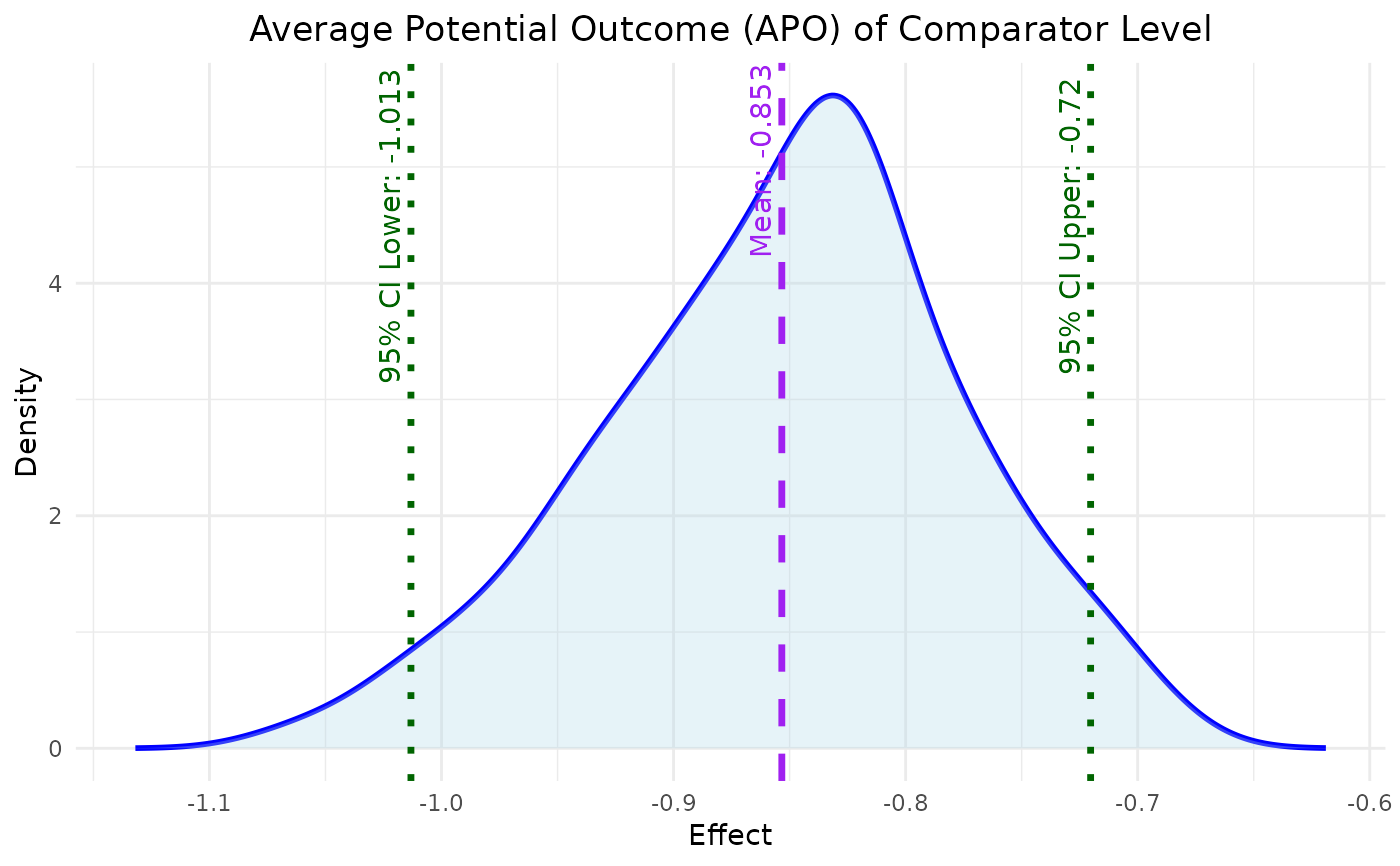
A ggplot object representing density plot showing the distribution of the specified average potential outcome (reference or comparison).
Examples
# 1) Specify simple treatment‐assignment models
amodel <- list(
  c("(Intercept)" =  0, "L1_1" =  0.5, "L2_1" = -0.5),
  c("(Intercept)" =  0, "L1_2" =  0.5, "L2_2" = -0.5, "A_prev" = 0.3)
)
# 2) Specify a continuous‐outcome model
ymodel <- c("(Intercept)" = 0,
            "A1"         = 0.2,
            "A2"         = 0.3,
            "L1_2"       = 0.1,
            "L2_2"       = -0.1)
# 3) Simulate without right‐censoring
testdata <- simData(
  n                = 200,
  n_visits         = 2,
  covariate_counts = c(2, 2),
  amodel           = amodel,
  ymodel           = ymodel,
  y_type           = "continuous",
  right_censor     = FALSE,
  seed             = 123)
model <- bayesmsm(ymodel = Y ~ A1 + A2,
                  nvisit = 2,
                  reference = c(rep(0,2)),
                  comparator = c(rep(1,2)),
                  treatment_effect_type = "sq",
                  family = "binomial",
                  data = testdata,
                  wmean = rep(1,200),
                  nboot = 10,
                  optim_method = "BFGS",
                  seed = 890123,
                  parallel = FALSE)
plot_APO(model$bootdata, effect_type = "effect_comparator")

plot_APO(model, effect_type = "effect_reference")